
In my previous post I provided an overview of my time on placement. What I’d like to do with this post, is give a little more insight into the on goings of the haematology laboratory, the sections within it that a biomedical scientist can work in and what goes on in these sections.
The haematology laboratory is broken down into operating sections. During a working day, each biomedical scientist (BMS) will be assigned a section to work on. They will then be required to carry out all of the necessary duties involved with running that section. However, the layout of the lab is not arbitrary. It has been positioned strategically and It’s all do with the volumes of blood used by each analyser.
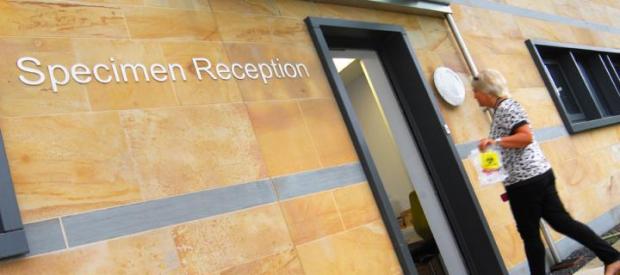
Before a sample reaches any of the testing laboratories it enters specimen reception. Here, all of the samples are taken in by various means. They can be dropped over by porters, community nurses leave their samples in and some come through the chute system from the more urgent ward environments such as the emergency department or intensive care unit (ICU).
Every single sample that enters the laboratory comes through here. It includes, but is not limited to: blood, urine, faeces, sputum, sperm and various surgically resected specimens such as tumours or organs (although in our laboratory there is a separate specimen reception for histopathology samples). Once in specimen reception, the laboratory healthcare science assistants begin the process of PIDing. It is here that the reception staff, check the sample details to ensure the sample can be accepted. There is a standard operating procedure (SOP) in place that details what is or isn’t acceptable. Samples are then given a unique laboratory accession number, and placed in their relevant holding area to be collected by a BMS from each of the laboratories. Even rejected samples get these numbers. This is so a comment can be logged stating why the sample was rejected.
Haematology
At various periods throughout the day, either a healthcare science assistant or a BMS will head to specimen reception to collect the samples that have been building up over the day. They return with these to the lab and place them into numbered racks which hold ten samples each. The racks are then placed onto a track system. A series of conveyor belts and barcode readers which takes the rack through each of the analysers according to which samples need to go where. The track system is electronically monitored and this allows the BMS to find any sample they need, by punching in the laboratory accession number to the computer system. The computer can then see which rack the sample is in and where that rack is, making life easy for the BMS who doesn’t have to go on an Easter egg hunt to find a single sample.
Ok, so the sample is now in the laboratory, but where can it go and what can happen to it? Well, that’s where each specific section comes in. There are four sections in the haematology laboratory:
Automated
This is the workhorse of the haematology laboratory. The majority of people have had their blood analysed in this section if they’ve ever had blood drawn. The full blood counts (FBC) are conducted here by analysers using numerous analytical methods to count the cells and assess their characteristics. Flow cytometry being the key functional method, along with RF/DC electrical impedance testing and the SLS haemoglobin method. This section also has a separate slide stainer which makes blood films for analysis by a BMS working in a different section.
This section is the first along the track system. In fact, when you place the rack onto the track, the barcode is read and if there are samples in that rack requiring a FBC then the rack need only move the length of a ruler to reach the analyser. As I alluded to earlier, there is good reason for this. This is by far the most common test requested in haematology. An FBC can provide a vast amount of clinical information to those who require it. If the clinicians need to see what’s going on but aren’t sure of exactly how to approach the problem, an FBC can provide some key information to them. As well as that, It’s invaluable in the monitoring of numerous haematological disorders. It also takes the least amount of sample to perform its testing.
Erythrocyte Sedimentation Rate (ESR)/Miscellaneous
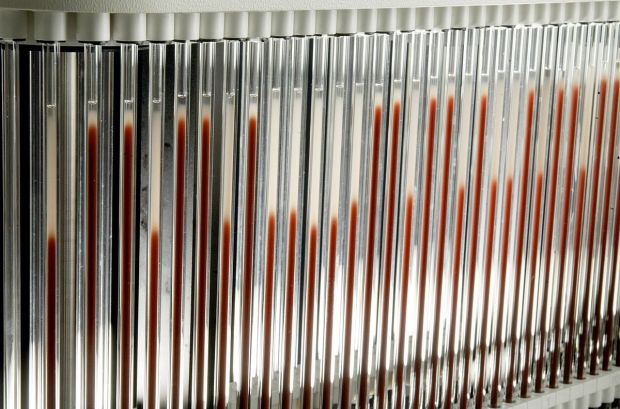
The ESR assay is a method used to assess inflammatory processes in the body. Where a sample is left to sit undisturbed, the sample will naturally separate out to its constituent parts. The ESR analyser exploits this natural property and measures red cell separation from plasma using a linear method to determine the degree of separation. Samples are drawn up into glass tubes in a carousel. These tubes rotate around the carousel for thirty minutes and then they are read and a mathematical equation is used to determine the rate of separation over one hour.
When the body undergoes an inflammatory process, it produces a number of proteins in response to whatever is causing the inflammation. Some of these protein markers attach themselves to red cells and this causes them to fall faster in the tube giving a greater degree of separation. It isn’t necessarily the most efficient inflammatory marker available, but it’s cheap and the GP’s absolutely love them.
Miscellaneous tests are also covered here. Anything that doesn’t fall neatly into the other categories is done at this section. Kleihauer tests to determine the presence of feotal maternal haemorrhage, some samples are stained manually such as for iron, haptoglobin tests to help assess for haemolytic anaemia and monospot testing for infectious mononucleosis or “glandular fever” are just a few examples.
Coagulation
This is the section which assesses the blood’s ability to clot or “coagulate” effectively. The sample is loaded onto the analyser and calcium is added to the sample to initiate coagulation. Calcium is a very important cofactor in the coagulation cascade, a series of proteolytic reactions which sequentially activate a further protein factor until reaching the final stable of forming an insoluble fibrin clot.

The above image is well known for inducing palpitations amongst biological, biomedical and medical students. It is the coagulation cascade in all Its magnificent glory. I use this image as it is one of the less cluttered versions but I must say after a couple of years of trying to get my head around it, I quite like it.
Various tests and measurements are taken during the process and these allow us to make a judgement on how well the blood is clotting. A prothrombin time is taken to assess the extrinsic pathway, whilst an activated partial thromboplastin time is a measure of the intrinsic pathway. I find pathologies of coagulation to be a very interesting side of life in haematology. Haemophilia A/B, thrombophilia, disseminated intravascular coagulability (DIC) and deficiencies in any of the factors associated with the clotting pathways are all issues which can be explained by a coagulation screen.
Differential White Cell Counts (DWCC)
This section involves manual microscopic techniques to assess a peripheral blood film. It’s probably more of what the lay person thinks of when they think of a scientist. Someone hunched over a microscope all day, making observations and only leaning away to make some brief noted before returning to their microscope.
The analysers used in the automated section can and do perform an automated DWCC or an “auto diff” as we call them. However there are certain criteria in which we must assess peripheral bloods ourselves. Key here, is the ability to identify the numerous blood cells and whether or not they look normal. I use the term normal very loosely. If you’ve ever attempted to look at a blood film without much training in haematology you’ll probably have remarked at how two cells which are supposedly the same, look rather different. The cells do have common characteristics which we use to identify them, but they can be at various stages of differentiation and they could also be reacting to changes in the blood. This can make them quite difficult to recognise as a particular cell.
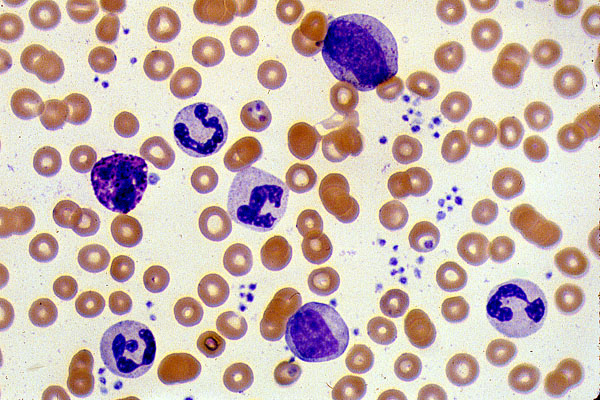
An example of a normal peripheral blood smear is shown above. It is a good example to show the various cells encountered when examining a blood smear. Red cells, shown in red are a nice circular shape with an area of central pallor. White cells are the ones with a purplish staining to them, the nuclei of white cells pick up this purple particularly strongly. We can use the shape of the nuclei to identify which type of white cell these are and the cytoplasmic staining also provides further indication. The smaller purple dots seen in abundance to the right side of the image are platelets. Commonly referred to as cell fragments because they are formed by the disintegration of megakaryocytes.
Summary
Hopefully I’ve been able to provide you with a basic introduction to the haematology laboratory and what goes on. As you can see the level of knowledge a BMS in haematology is required to hold is quite vast. Especially as one progresses through the ranks to becoming a specialist and advanced specialist, the depth of knowledge increases exponentially. Next time you have some blood drawn, spare a thought for the BMS behind the scenes wracking his or her brains to provide much needed clinical information to your doctor.
